Styling figure axes#
[1]:
import matplotlib.pyplot as plt

from tueplots import axes

# Increase the resolution of all the plots below
plt.rcParams.update({"figure.dpi": 150})
We can change the axes behaviour via tueplots.axes.
[2]:
axes.lines()
[2]:
{'axes.linewidth': 0.5,
 'lines.linewidth': 1.0,
 'xtick.major.width': 0.5,
 'ytick.major.width': 0.5,
 'xtick.minor.width': 0.25,
 'ytick.minor.width': 0.25,
 'xtick.major.size': 3.0,
 'ytick.major.size': 3.0,
 'xtick.minor.size': 2.0,
 'ytick.minor.size': 2.0,
 'grid.linewidth': 0.5,
 'patch.linewidth': 0.5,
 'legend.edgecolor': 'inherit',
 'axes.axisbelow': True}
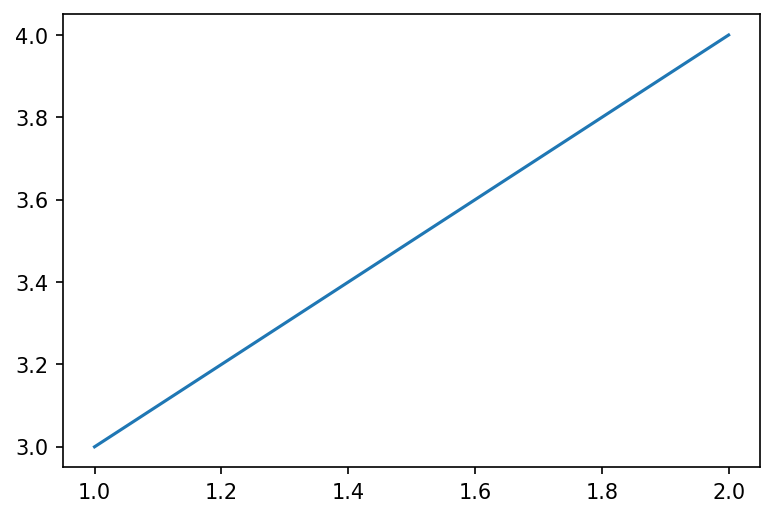
[3]:
fig, ax = plt.subplots()
ax.plot([1.0, 2.0], [3.0, 4.0])
plt.show()
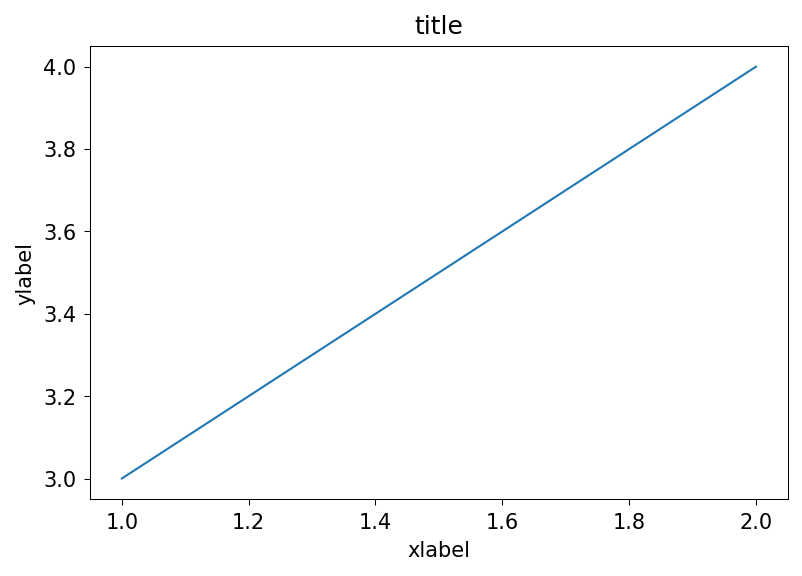
[4]:
plt.rcParams.update(axes.lines())
fig, ax = plt.subplots()
ax.plot([1.0, 2.0], [3.0, 4.0])
ax.set_xlabel("xlabel")
ax.set_ylabel("ylabel")
ax.set_title("title")
plt.show()
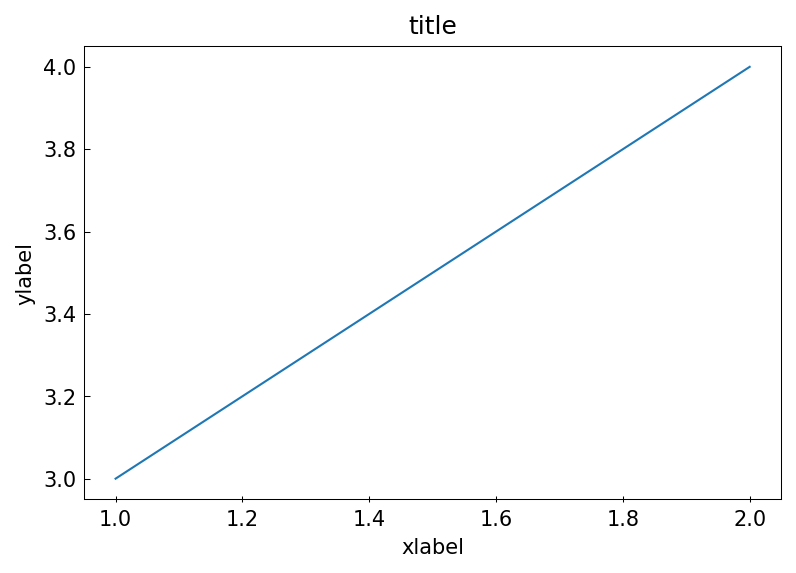
[5]:
plt.rcParams.update(axes.tick_direction(x="inout", y="in"))
fig, ax = plt.subplots()
ax.plot([1.0, 2.0], [3.0, 4.0])
ax.set_xlabel("xlabel")
ax.set_ylabel("ylabel")
ax.set_title("title")
plt.show()
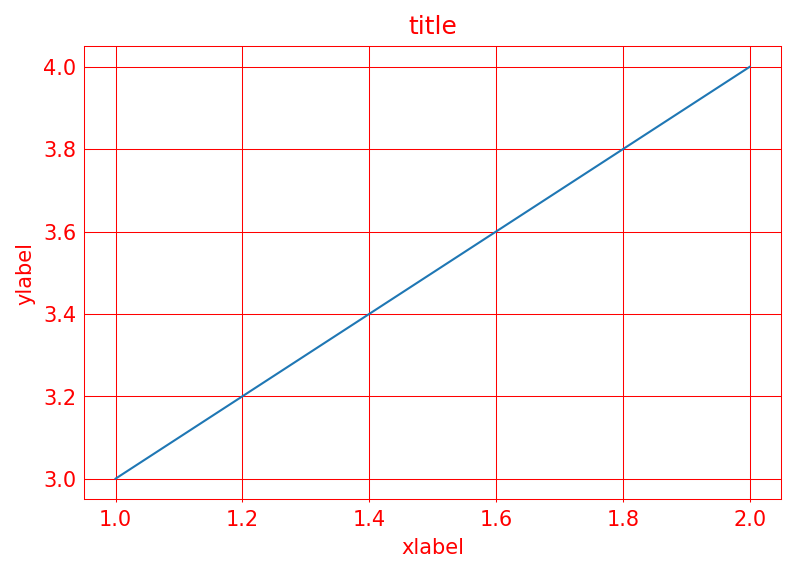
[6]:
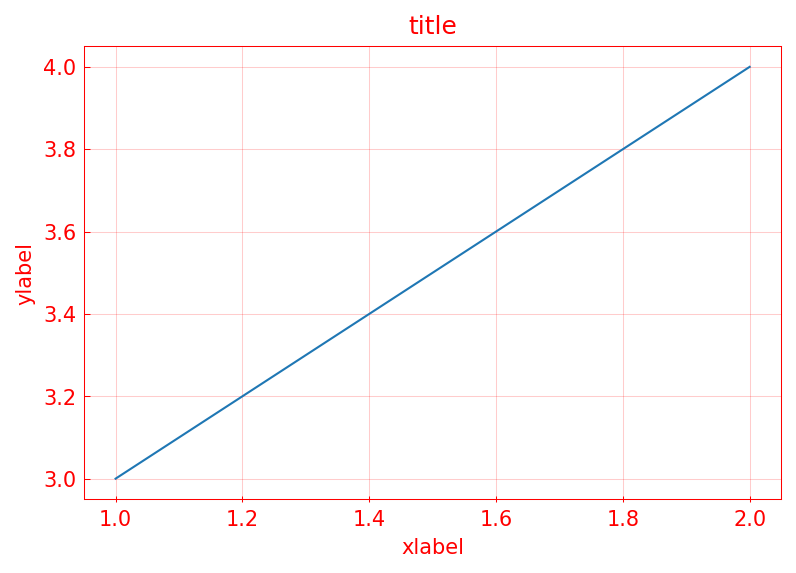
plt.rcParams.update(axes.color(base="red"))
fig, ax = plt.subplots()
ax.plot([1.0, 2.0], [3.0, 4.0], label="ABC")
ax.set_xlabel("xlabel")
ax.set_ylabel("ylabel")
ax.set_title("title")
plt.grid()
plt.show()
[7]:
plt.rcParams.update(axes.grid())
fig, ax = plt.subplots()
ax.plot([1.0, 2.0], [3.0, 4.0], label="ABC")
ax.set_xlabel("xlabel")
ax.set_ylabel("ylabel")
ax.set_title("title")
plt.grid()
plt.show()
[8]:
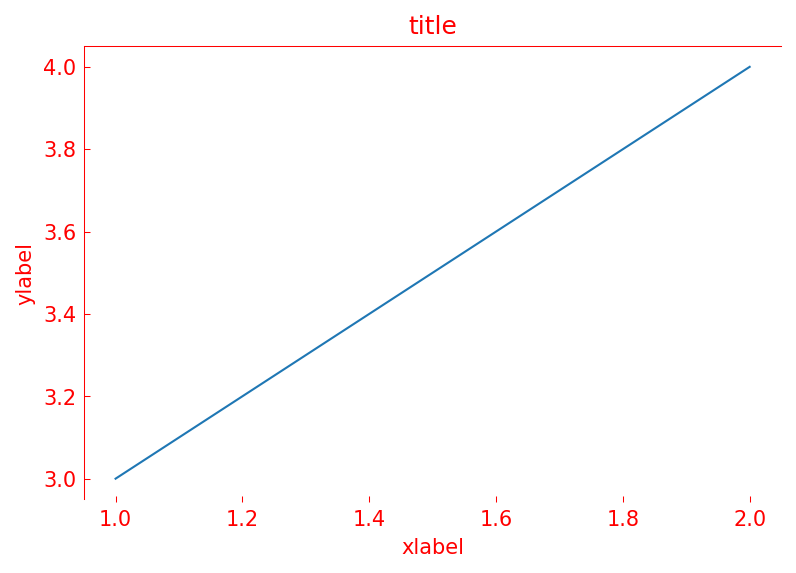
plt.rcParams.update(axes.spines(bottom=False, right=False))
fig, ax = plt.subplots()
ax.plot([1.0, 2.0], [3.0, 4.0])
ax.set_xlabel("xlabel")
ax.set_ylabel("ylabel")
ax.set_title("title")
plt.show()
[9]:
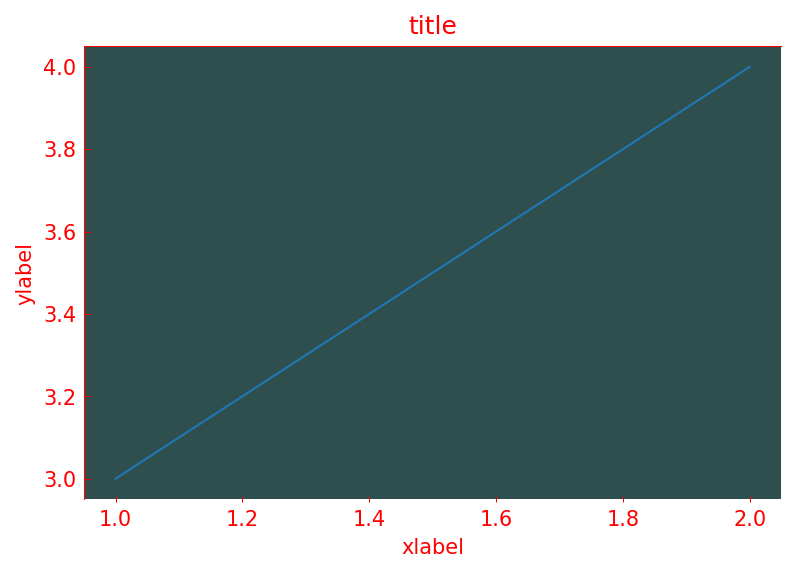
plt.rcParams.update(axes.color(face="darkslategray", base="red"))
fig, ax = plt.subplots()
ax.plot([1.0, 2.0], [3.0, 4.0])
ax.set_xlabel("xlabel")
ax.set_ylabel("ylabel")
ax.set_title("title")
plt.show()
[ ]: