Choosing the correct fonts#
[ ]:
import matplotlib.pyplot as plt

from tueplots import figsizes, fonts

# Increase the resolution of all the plots below
plt.rcParams.update({"figure.dpi": 150})

# "Better" figure size to display the font-changes
plt.rcParams.update(figsizes.icml2022_half())
Fonts in tueplots follow the same interface as the other settings.
There are some pre-defined font recipes for a few journals, and they return dictionaries that are compatible with matplotlib.pyplot.rcParams.update().
[2]:
fonts.neurips2021()
[2]:
{'text.usetex': False,
 'font.serif': ['Times New Roman'],
 'mathtext.fontset': 'stix',
 'mathtext.rm': 'Times New Roman',
 'mathtext.it': 'Times New Roman:italic',
 'mathtext.bf': 'Times New Roman:bold',
 'font.family': 'serif'}
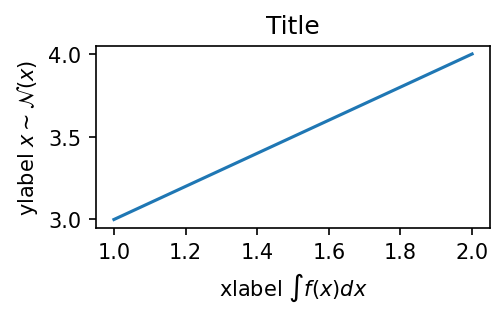
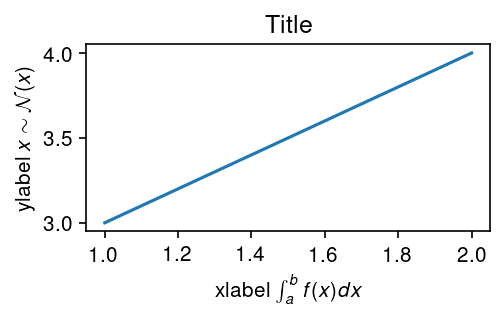
Compare the following default font to some of the alternatives that we provide:
[3]:
fig, ax = plt.subplots()
ax.plot([1.0, 2.0], [3.0, 4.0])
ax.set_title("Title")
ax.set_xlabel("xlabel $\int f(x) dx$")
ax.set_ylabel("ylabel $x \sim \mathcal{N}(x)$")
plt.show()
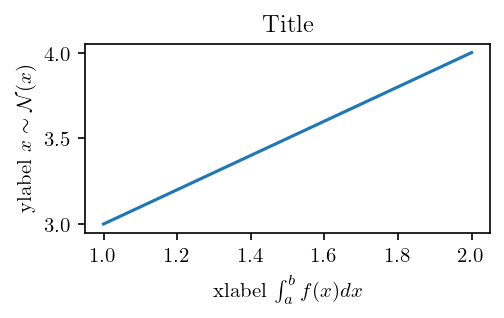
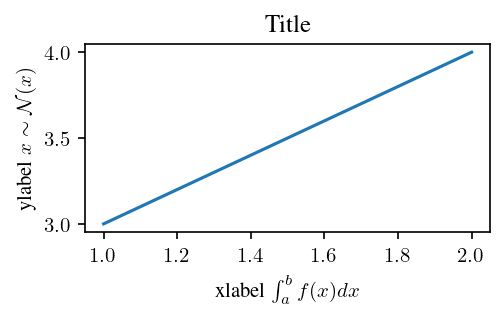
[4]:
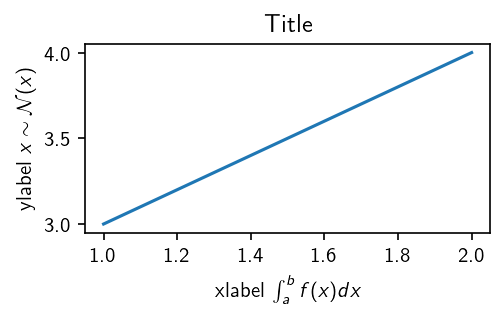
plt.rcParams.update(fonts.jmlr2001_tex(family="serif"))
fig, ax = plt.subplots()
ax.plot([1.0, 2.0], [3.0, 4.0])
ax.set_title("Title")
ax.set_xlabel("xlabel $\int_a^b f(x) dx$")
ax.set_ylabel("ylabel $x \sim \mathcal{N}(x)$")
plt.show()
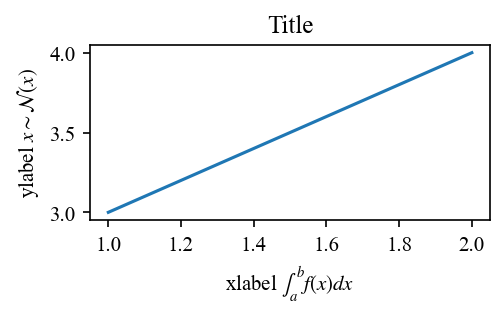
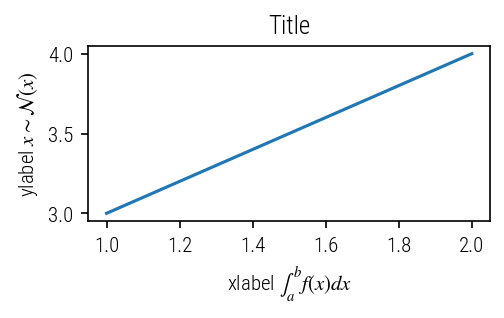
[5]:
plt.rcParams.update(fonts.jmlr2001_tex(family="sans-serif"))
fig, ax = plt.subplots()
ax.plot([1.0, 2.0], [3.0, 4.0])
ax.set_title("Title")
ax.set_xlabel("xlabel $\int_a^b f(x) dx$")
ax.set_ylabel("ylabel $x \sim \mathcal{N}(x)$")
plt.show()

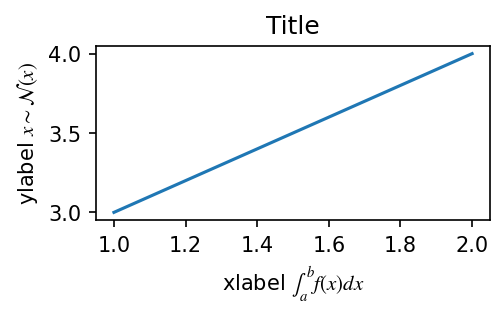
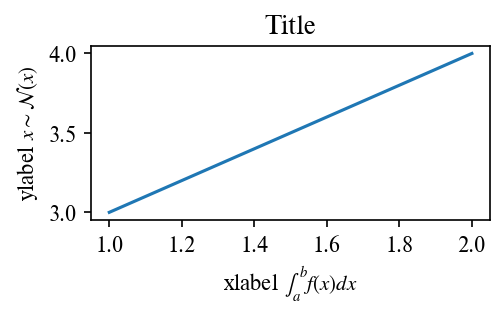
[6]:
plt.rcParams.update(fonts.neurips2021())
fig, ax = plt.subplots()
ax.plot([1.0, 2.0], [3.0, 4.0])
ax.set_title("Title")
ax.set_xlabel("xlabel $\int_a^b f(x) dx$")
ax.set_ylabel("ylabel $x \sim \mathcal{N}(x)$")
plt.show()
[7]:
plt.rcParams.update(fonts.neurips2021(family="sans-serif"))
fig, ax = plt.subplots()
ax.plot([1.0, 2.0], [3.0, 4.0])
ax.set_title("Title")
ax.set_xlabel("xlabel $\int_a^b f(x) dx$")
ax.set_ylabel("ylabel $x \sim \mathcal{N}(x)$")
plt.show()
[8]:
plt.rcParams.update(fonts.neurips2021_tex(family="sans-serif"))
fig, ax = plt.subplots()
ax.plot([1.0, 2.0], [3.0, 4.0])
ax.set_title("Title")
ax.set_xlabel("xlabel $\int_a^b f(x) dx$")
ax.set_ylabel("ylabel $x \sim \mathcal{N}(x)$")
plt.show()
[9]:
plt.rcParams.update(fonts.neurips2021_tex(family="serif"))
fig, ax = plt.subplots()
ax.plot([1.0, 2.0], [3.0, 4.0])
ax.set_title("Title")
ax.set_xlabel("xlabel $\int_a^b f(x) dx$")
ax.set_ylabel("ylabel $x \sim \mathcal{N}(x)$")
plt.show()
[10]:
plt.rcParams.update(fonts.beamer_moml())
fig, ax = plt.subplots()
ax.plot([1.0, 2.0], [3.0, 4.0])
ax.set_title("Title")
ax.set_xlabel("xlabel $\int_a^b f(x) dx$")
ax.set_ylabel("ylabel $x \sim \mathcal{N}(x)$")
plt.show()
[11]:
with plt.rc_context(fonts.icml2022()):
    fig, ax = plt.subplots()
    ax.plot([1.0, 2.0], [3.0, 4.0])
    ax.set_title("Title")

    ax.set_xlabel("xlabel $\int_a^b f(x) dx$")
    ax.set_ylabel("ylabel $x \sim \mathcal{N}(x)$")
    plt.show()
[12]:
with plt.rc_context(fonts.icml2022_tex(family="sans-serif")):
    fig, ax = plt.subplots()
    ax.plot([1.0, 2.0], [3.0, 4.0])
    ax.set_title("Title")
    ax.set_xlabel("xlabel $\int_a^b f(x) dx$")
    ax.set_ylabel("ylabel $x \sim \mathcal{N}(x)$")
    plt.show()

[13]:
with plt.rc_context(fonts.icml2022_tex(family="serif")):
    fig, ax = plt.subplots()
    ax.plot([1.0, 2.0], [3.0, 4.0])
    ax.set_title("Title")
    ax.set_xlabel("xlabel $\int_a^b f(x) dx$")
    ax.set_ylabel("ylabel $x \sim \mathcal{N}(x)$")
    plt.show()

[14]:
plt.rcParams.update(fonts.aistats2022_tex(family="serif"))
fig, ax = plt.subplots()
ax.plot([1.0, 2.0], [3.0, 4.0])
ax.set_title("Title")
ax.set_xlabel("xlabel $\int_a^b f(x) dx$")
ax.set_ylabel("ylabel $x \sim \mathcal{N}(x)$")
plt.show()

[15]:
plt.rcParams.update(fonts.aistats2022_tex(family="sans-serif"))
fig, ax = plt.subplots()
ax.plot([1.0, 2.0], [3.0, 4.0])
ax.set_title("Title")
ax.set_xlabel("xlabel $\int_a^b f(x) dx$")
ax.set_ylabel("ylabel $x \sim \mathcal{N}(x)$")
plt.show()
[ ]: