Creating color-cycles#
[1]:
import matplotlib.pyplot as plt
import numpy as np

from tueplots import cycler
from tueplots.constants import markers
from tueplots.constants.color import palettes

# Increase the resolution of all the plots below
plt.rcParams.update({"figure.dpi": 150})
cycler objects define the default color choices in matplotlib (e.g., blue-orange-red-…). Like most other settings provided in tueplots, the outputs of cycler are directly compatible with plt.rcParams.update() (which is different to the cycler object in matplotlib in that it wraps them into a dictionary).
We can control the cyclers through the constants in tueplots.constants. To see this, let us generate some lines to be plotted. (Setup taken from https://matplotlib.org/stable/tutorials/intermediate/color_cycle.html).
[2]:
x = np.linspace(0, np.pi, 20)
offsets = np.linspace(0, 2 * np.pi, 8, endpoint=False)
yy = [np.sin(x + phi) for phi in offsets]
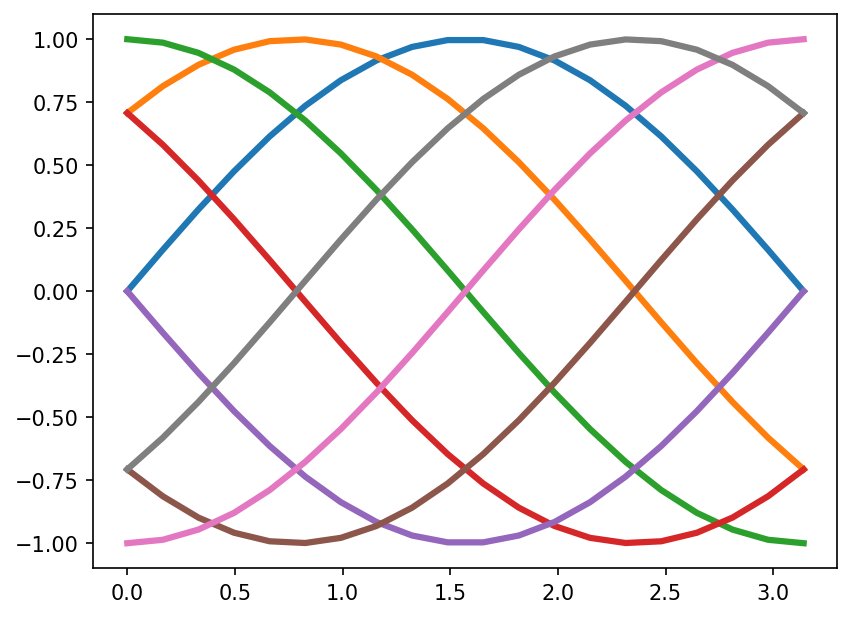
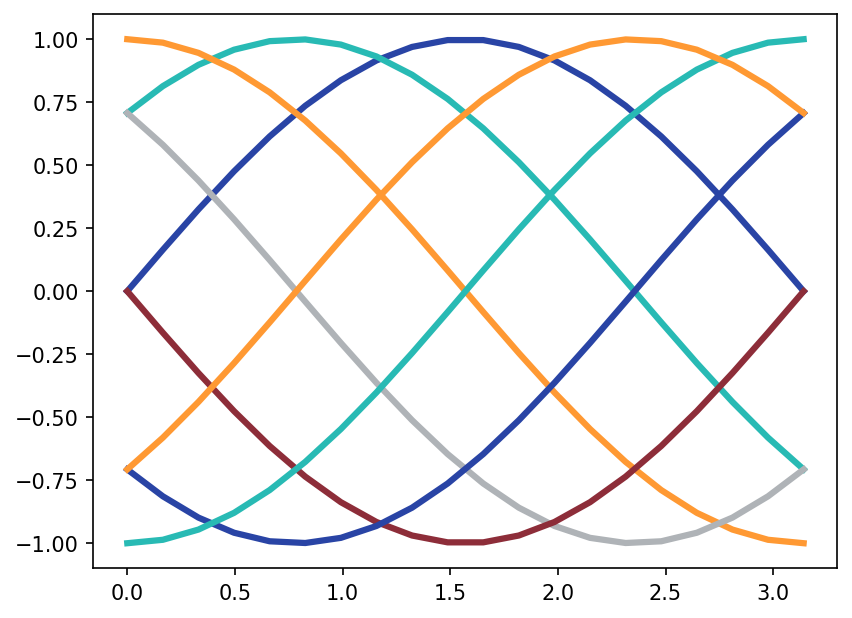
The following are the default colors:
[3]:
for y in yy:
    plt.plot(x, y, linewidth=3)
plt.show()
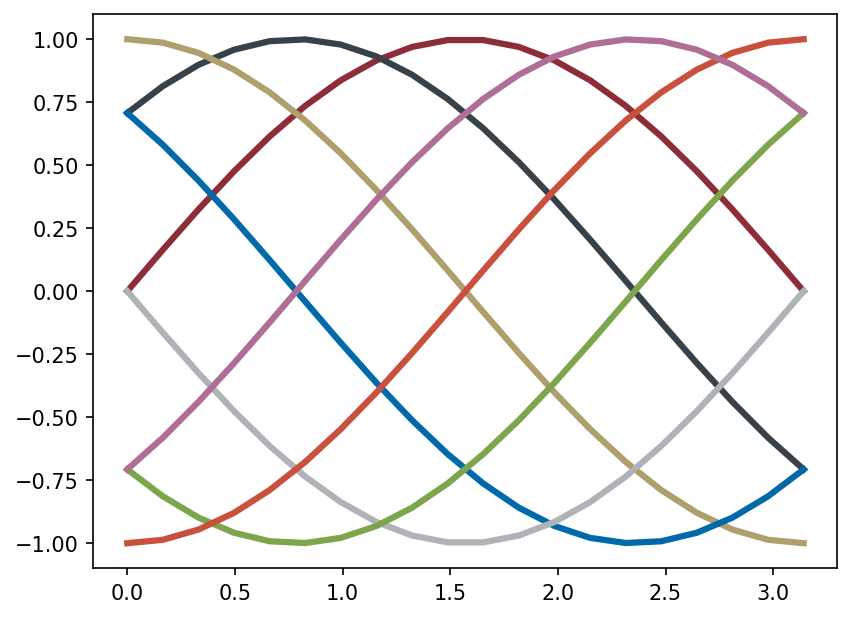
Through the dictionaries provided by tueplots, we can change the default color behaviour as follows.
[4]:
plt.rcParams.update(cycler.cycler(color=palettes.tue_plot))
for y in yy:
    plt.plot(x, y, linewidth=3)
plt.show()
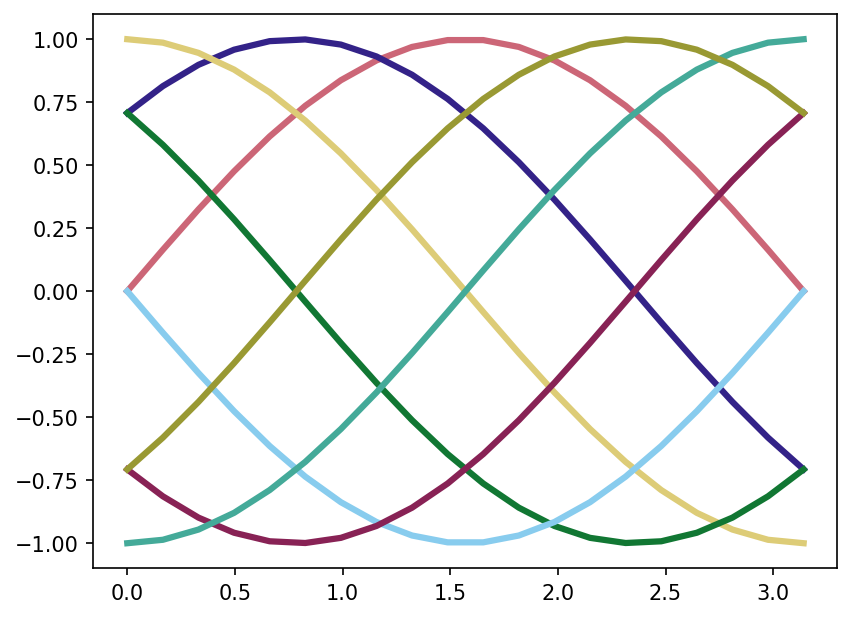
[5]:
plt.rcParams.update(cycler.cycler(color=palettes.paultol_muted))
for y in yy:
    plt.plot(x, y, linewidth=3)
plt.show()
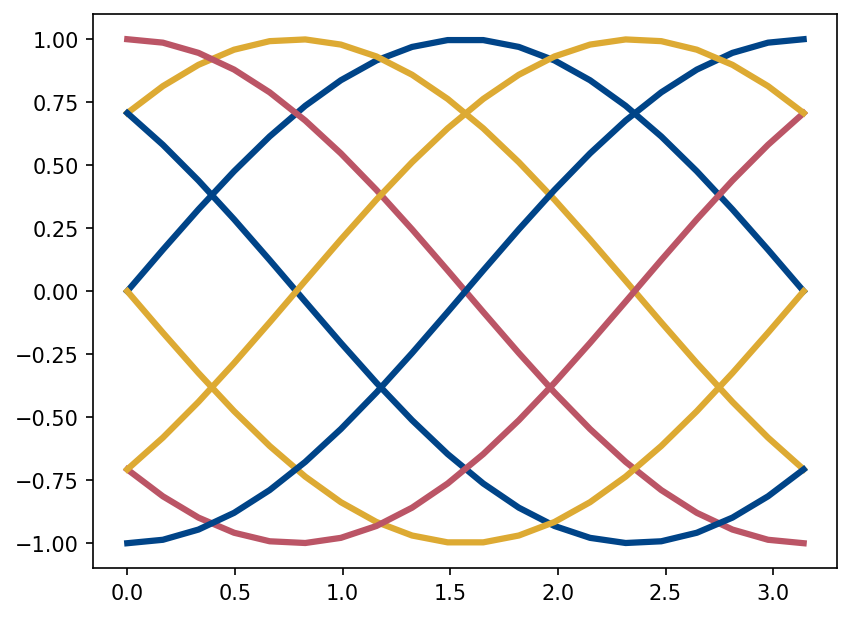
[6]:
plt.rcParams.update(cycler.cycler(color=palettes.paultol_high_contrast))
for y in yy:
    plt.plot(x, y, linewidth=3)
plt.show()
[7]:
plt.rcParams.update(cycler.cycler(color=palettes.pn))
for y in yy:
    plt.plot(x, y, linewidth=3)
plt.show()
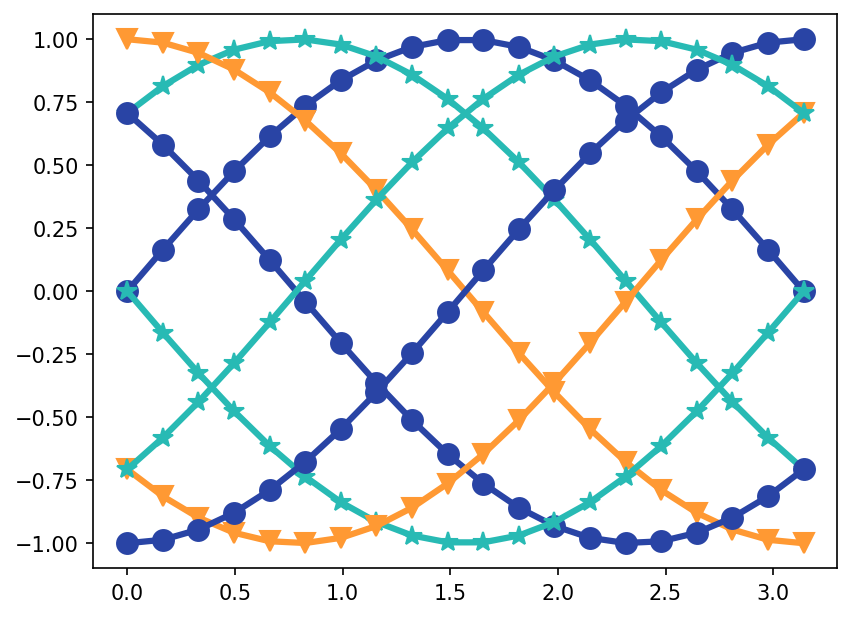
We can also cycle linestyles and markers.
[8]:
plt.rcParams.update(cycler.cycler(color=palettes.pn[:3], marker=markers.o_sized[:3]))
for y in yy:
    plt.plot(x, y, linewidth=3, markersize=10)
plt.show()
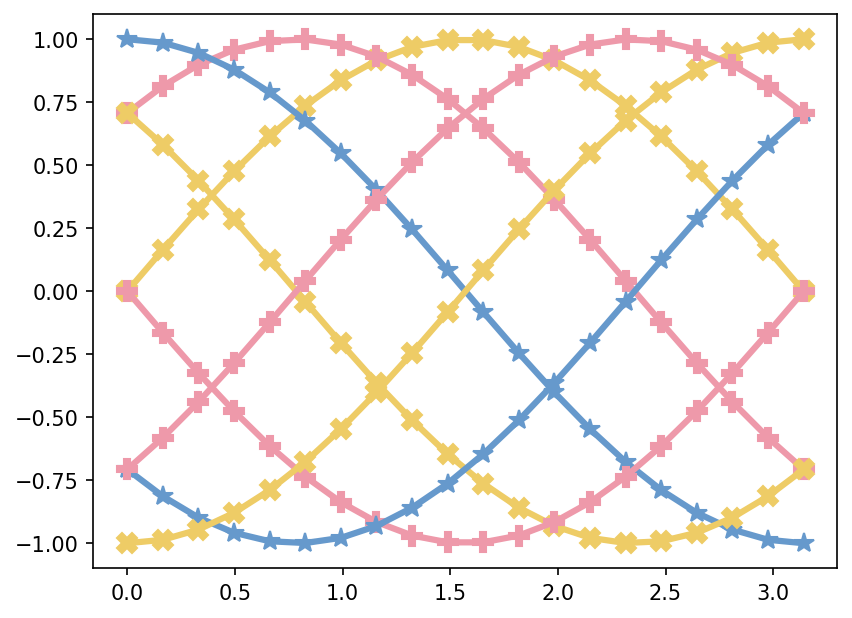
[9]:
plt.rcParams.update(
    cycler.cycler(color=palettes.paultol_vibrant[:3], marker=markers.x_like_bold[:3])
)
for y in yy:
    plt.plot(x, y, linewidth=3, markersize=10)
plt.show()
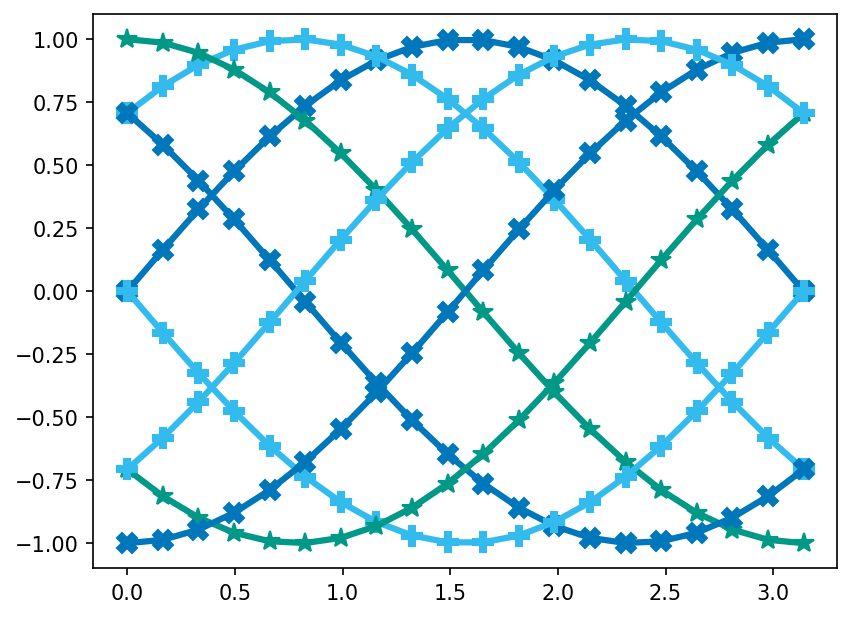
[10]:
plt.rcParams.update(
    cycler.cycler(
        color=palettes.paultol_medium_contrast[:3], marker=markers.x_like_bold[:3]
    )
)
for y in yy:
    plt.plot(x, y, linewidth=3, markersize=10)
plt.show()
[ ]: