Convenient plot-configs with bundles#
[1]:
import matplotlib.pyplot as plt

from tueplots import axes, bundles

# Increase the resolution of all the plots below
plt.rcParams.update({"figure.dpi": 150})
tueplots provides a few prepackaged bundles that can be plugged right into matplotlib’s context manager.
[2]:
bundles.icml2022()
[2]:
{'text.usetex': True,
 'font.family': 'serif',
 'text.latex.preamble': '\\usepackage{times} ',
 'figure.figsize': (3.25, 2.0086104634371584),
 'figure.constrained_layout.use': True,
 'figure.autolayout': False,
 'savefig.bbox': 'tight',
 'savefig.pad_inches': 0.015,
 'font.size': 8,
 'axes.labelsize': 8,
 'legend.fontsize': 6,
 'xtick.labelsize': 6,
 'ytick.labelsize': 6,
 'axes.titlesize': 8}
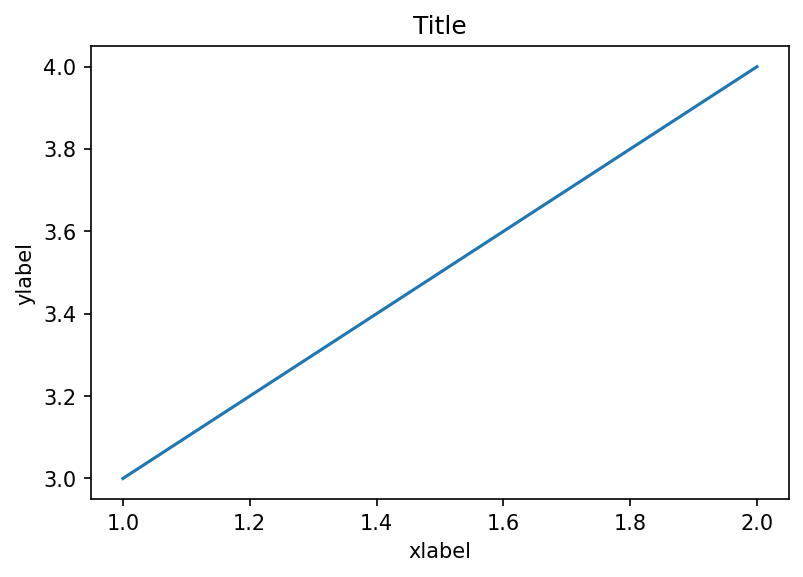
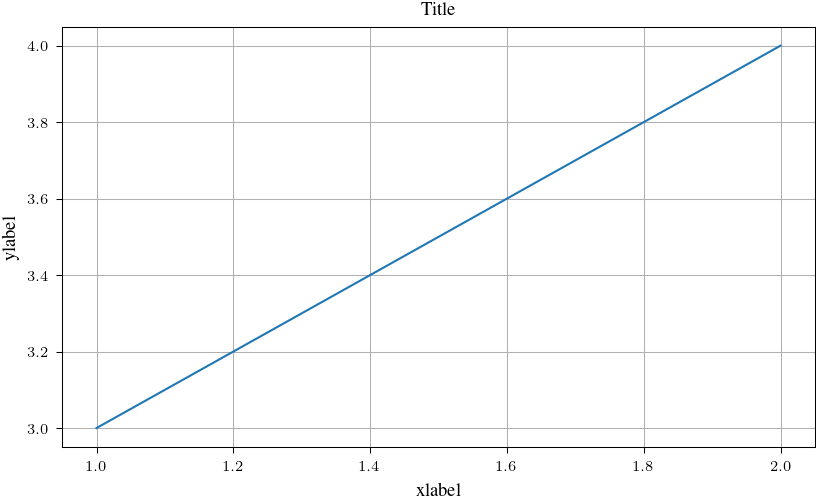
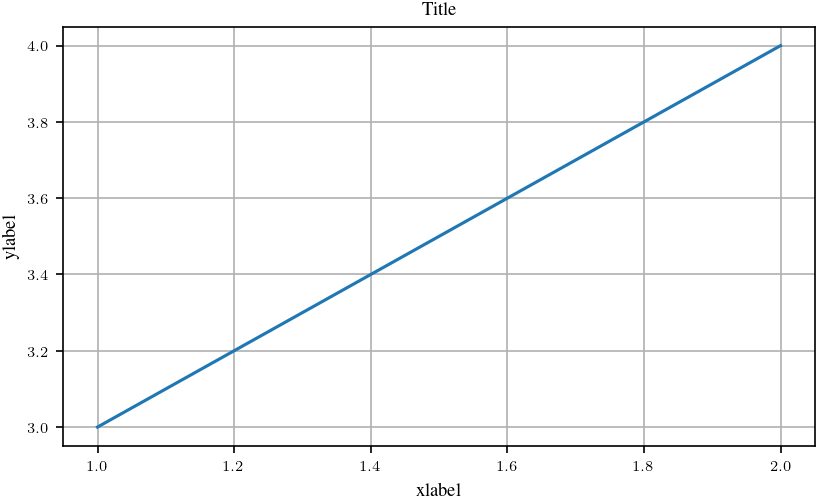
Compare the default plots to the context plots below.
[3]:
fig, ax = plt.subplots()
ax.plot([1.0, 2.0], [3.0, 4.0])
ax.set_title("Title")
ax.set_xlabel("xlabel")
ax.set_ylabel("ylabel")
plt.show()
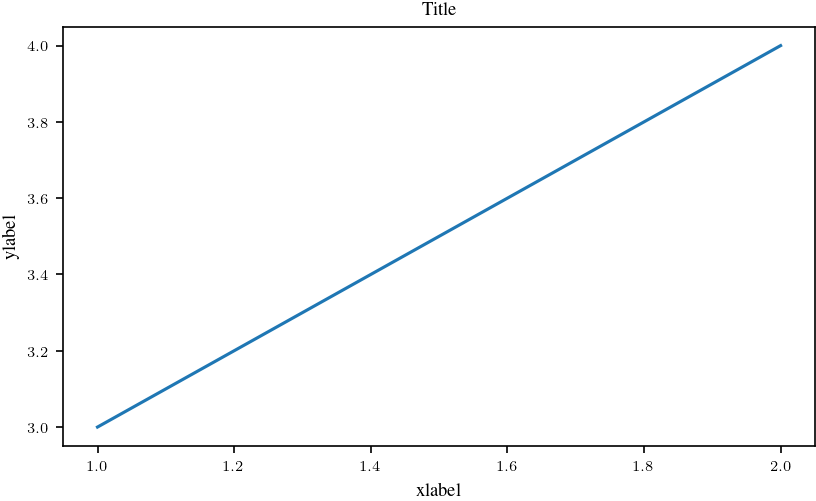
[4]:
with plt.rc_context(bundles.neurips2021()):
    fig, ax = plt.subplots()
    ax.plot([1.0, 2.0], [3.0, 4.0])
    ax.set_title("Title")
    ax.set_xlabel("xlabel")
    ax.set_ylabel("ylabel")
    plt.show()
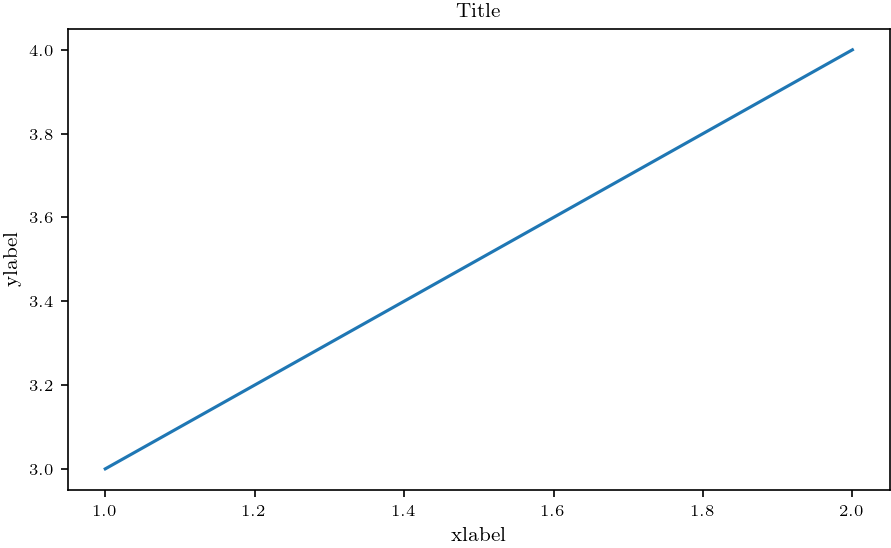
[5]:
with plt.rc_context(bundles.jmlr2001(family="serif")):
    fig, ax = plt.subplots()
    ax.plot([1.0, 2.0], [3.0, 4.0])
    ax.set_title("Title")
    ax.set_xlabel("xlabel")
    ax.set_ylabel("ylabel")
    plt.show()
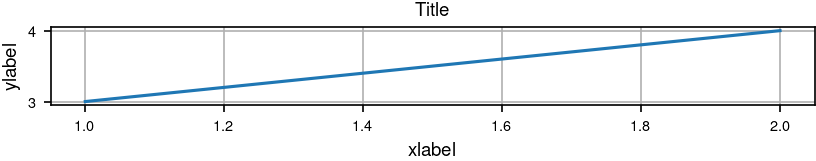
To get some (subjective) default behaviour, combine the bundles with axes.lines() (which is highly customisable, but has some opinionated default arguments).
[6]:
with plt.rc_context({**bundles.neurips2021(), **axes.lines()}):
    fig, ax = plt.subplots()
    ax.plot([1.0, 2.0], [3.0, 4.0])
    ax.set_title("Title")
    ax.set_xlabel("xlabel")
    ax.set_ylabel("ylabel")
    plt.grid()
    plt.show()
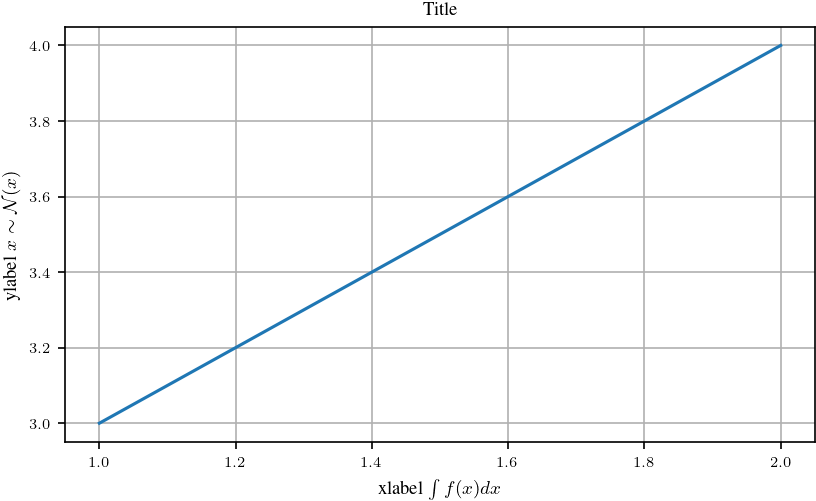
[7]:
with plt.rc_context(bundles.neurips2021(usetex=True, family="serif")):
    fig, ax = plt.subplots()
    ax.plot([1.0, 2.0], [3.0, 4.0])
    ax.set_title("Title")
    ax.set_xlabel("xlabel $\int f(x) dx$")
    ax.set_ylabel("ylabel $x \sim \mathcal{N}(x)$")
    plt.grid()
    plt.show()
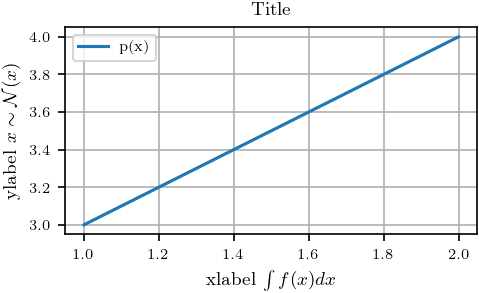
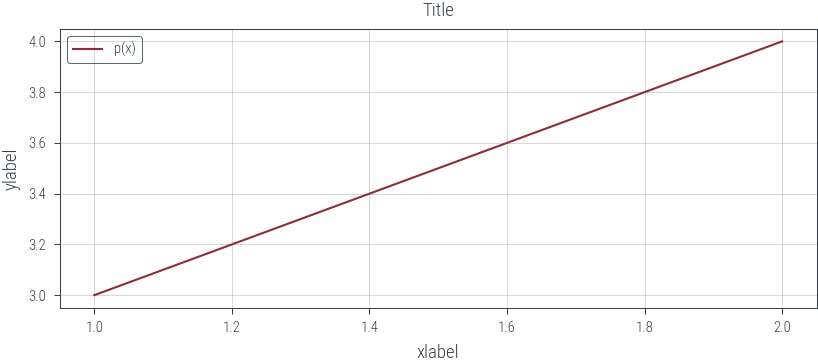
[8]:
with plt.rc_context({**bundles.icml2022(), **axes.lines()}):
    fig, ax = plt.subplots()
    ax.plot([1.0, 2.0], [3.0, 4.0], label="p(x)")
    ax.set_title("Title")
    ax.set_xlabel("xlabel $\int f(x) dx$")
    ax.set_ylabel("ylabel $x \sim \mathcal{N}(x)$")
    plt.grid()
    plt.legend()
    plt.show()

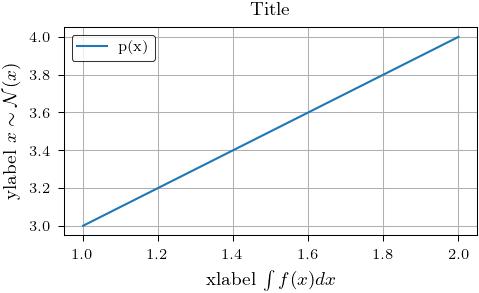
[9]:
with plt.rc_context(bundles.aistats2022()):
    fig, ax = plt.subplots()
    ax.plot([1.0, 2.0], [3.0, 4.0], label="p(x)")
    ax.set_title("Title")
    ax.set_xlabel("xlabel $\int f(x) dx$")
    ax.set_ylabel("ylabel $x \sim \mathcal{N}(x)$")
    plt.grid()
    plt.legend()
    plt.show()
[10]:
with plt.rc_context({**bundles.aistats2022(family="serif"), **axes.lines()}):
    fig, ax = plt.subplots()
    ax.plot([1.0, 2.0], [3.0, 4.0], label="p(x)")
    ax.set_title("Title")
    ax.set_xlabel("xlabel $\int f(x) dx$")
    ax.set_ylabel("ylabel $x \sim \mathcal{N}(x)$")
    plt.grid()
    plt.legend()
    plt.show()
[11]:
with plt.rc_context(bundles.beamer_moml()):
    fig, ax = plt.subplots()
    ax.plot([1.0, 2.0], [3.0, 4.0], label="p(x)")
    ax.legend()
    ax.set_title("Title")
    ax.set_xlabel("xlabel")
    ax.set_ylabel("ylabel")
    ax.grid()
    plt.show()
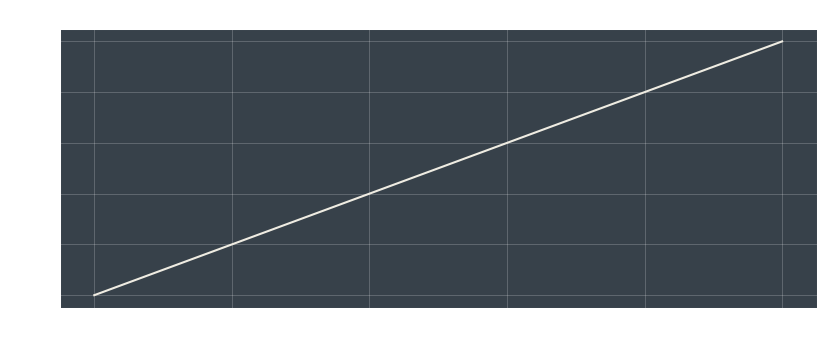
[12]:
with plt.rc_context(bundles.beamer_moml_dark_bg()):
    fig, ax = plt.subplots()
    ax.plot([1.0, 2.0], [3.0, 4.0])
    ax.set_title("Title")
    ax.set_xlabel("xlabel")
    ax.set_ylabel("ylabel")
    ax.grid()
    plt.show()
[13]:
with plt.rc_context(bundles.iclr2023()):
    fig, ax = plt.subplots()
    ax.plot([1.0, 2.0], [3.0, 4.0])
    ax.set_title("Title")
    ax.set_xlabel("xlabel")
    ax.set_ylabel("ylabel")
    ax.grid()
    plt.show()
[14]:
with plt.rc_context(
    bundles.iclr2023(usetex=True, nrows=1, ncols=3, family="smallcaps")
):
    fig, ax = plt.subplots()
    ax.plot([1.0, 2.0], [3.0, 4.0])
    ax.set_title("Title")
    ax.set_xlabel("xlabel")
    ax.set_ylabel("ylabel")
    ax.grid()
    plt.show()