Appropriate figure sizes#
[1]:
import matplotlib.pyplot as plt

from tueplots import figsizes

# Increase the resolution of all the plots below
plt.rcParams.update({"figure.dpi": 150})
Figure sizes are tuples. They describe the figure sizes in inches, just like what matplotlib expects.
Outputs of figsize functions are dictionaries that match rcParams.
[2]:
icml_size = figsizes.icml2022_full()
icml_size
[2]:
{'figure.figsize': (6.75, 2.0858647120308955),
 'figure.constrained_layout.use': True,
 'figure.autolayout': False,
 'savefig.bbox': 'tight',
 'savefig.pad_inches': 0.015}
We can use them to make differently sized figures. The height-to-width ratio is (loosely) based on the golden ratio.
[3]:
fig, ax = plt.subplots()
ax.plot([1.0, 2.0], [3.0, 4.0])
plt.show()
Figure sizes that match your latex template#
[4]:
plt.rcParams.update(figsizes.icml2022_full())

fig, ax = plt.subplots()
ax.plot([1.0, 2.0], [3.0, 4.0])
plt.show()

[5]:
plt.rcParams.update(figsizes.neurips2021())

fig, ax = plt.subplots()
ax.plot([1.0, 2.0], [3.0, 4.0])
plt.show()
[6]:
plt.rcParams.update(figsizes.aistats2022_full())

fig, ax = plt.subplots()
ax.plot([1.0, 2.0], [3.0, 4.0])
plt.show()
For double-column layouts such as ICML or AISTATS, there is also a single-column (i.e. half-width) version:
[7]:
plt.rcParams.update(figsizes.icml2022_half())
fig, ax = plt.subplots()
ax.plot([1.0, 2.0], [3.0, 4.0])
plt.show()

[8]:
plt.rcParams.update(figsizes.aistats2022_half())
fig, ax = plt.subplots()
ax.plot([1.0, 2.0], [3.0, 4.0])
plt.show()
Figure sizes that match your subplot layouts#
When working with plt.subplots, provide the nrows and ncols also to the figsize functions to get consistent subplot sizes by adjusting the overall figure height. Why? Because each subplot is fixed to a specific format (usually the golden ratio), and the figure width is commonly tied to the specific journal style. The remaining degree of freedom, the overall figure height, is adapted to make things look clean.
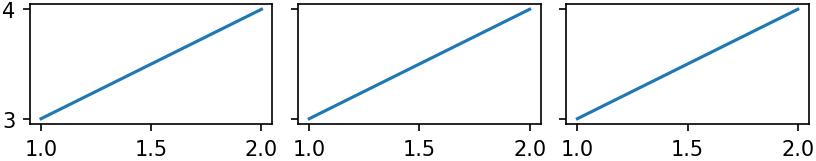
[9]:
plt.rcParams.update(figsizes.neurips2021(nrows=1, ncols=3))

fig, axes = plt.subplots(nrows=1, ncols=3, sharex=True, sharey=True)
for ax in axes.flatten():
    ax.plot([1.0, 2.0], [3.0, 4.0])
plt.show()
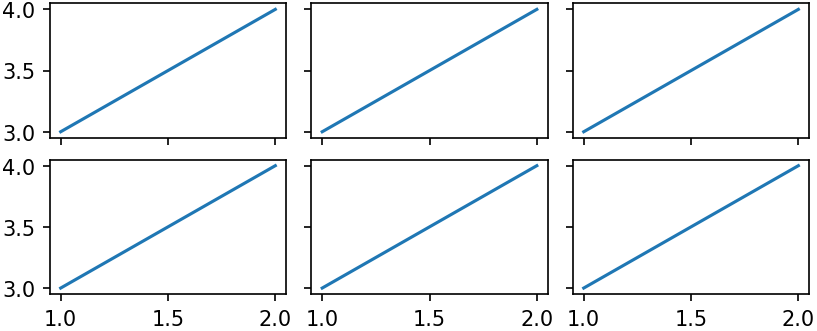
[10]:
plt.rcParams.update(figsizes.neurips2021(nrows=2, ncols=3))

fig, axes = plt.subplots(nrows=2, ncols=3, sharex=True, sharey=True)
for ax in axes.flatten():
    ax.plot([1.0, 2.0], [3.0, 4.0])
plt.show()
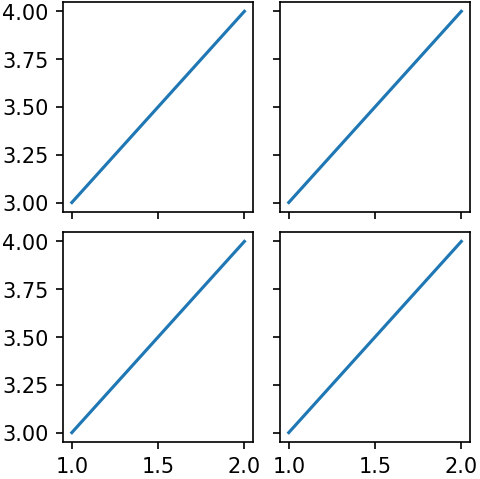
You can also customize the height_to_width_ratio:
[11]:
plt.rcParams.update(figsizes.icml2022_half(nrows=2, ncols=2, height_to_width_ratio=1.0))

fig, axes = plt.subplots(nrows=2, ncols=2, sharex=True, sharey=True)
for ax in axes.flatten():
    ax.plot([1.0, 2.0], [3.0, 4.0])
plt.show()
[ ]: